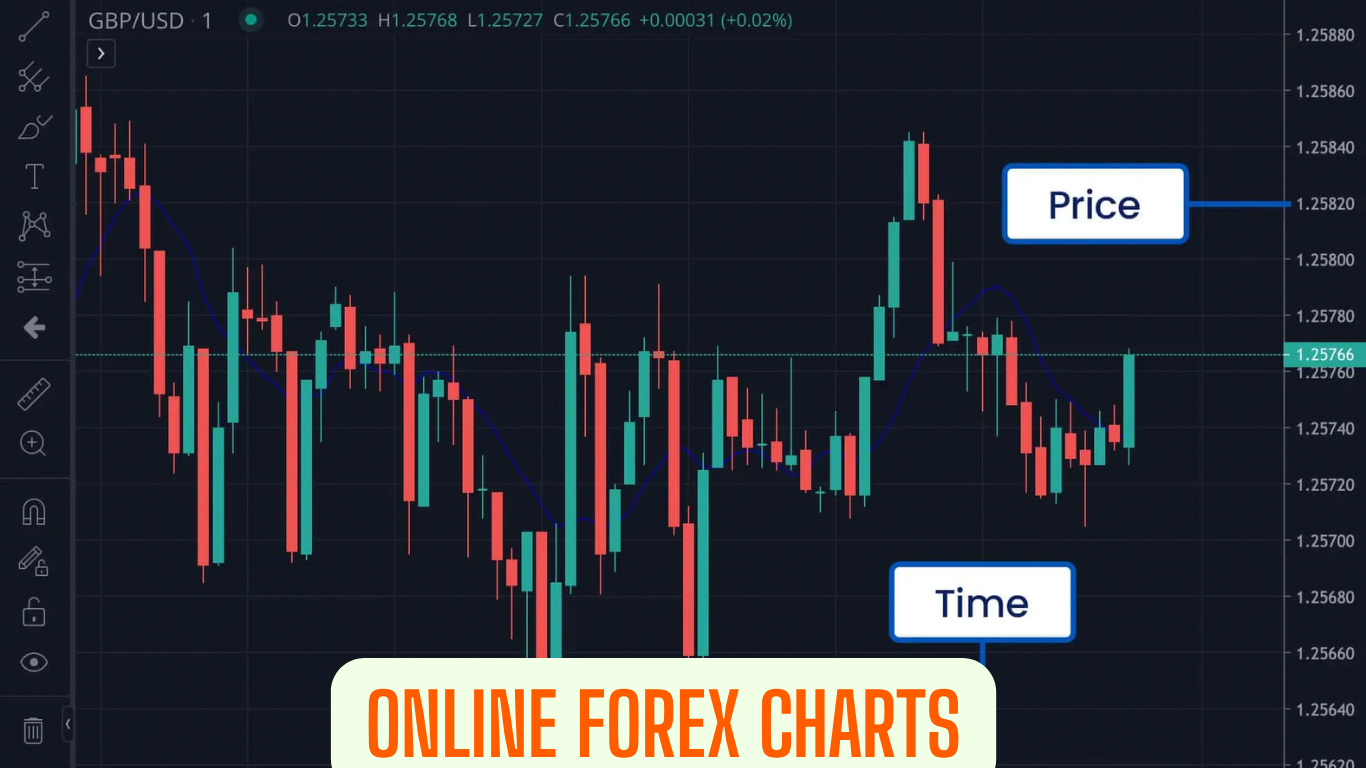
In the fast-paced world of Forex trading, where currency values fluctuate in real-time, having a clear visual representation of price movement is not just an advantage—it’s a necessity. Online Forex charts are the fundamental tool that provides this window into the market, transforming raw numerical data into actionable insights. These graphical interfaces allow traders, from beginners to seasoned professionals, to analyze historical trends, identify potential opportunities, and execute informed decisions. This comprehensive guide will take you through everything you need to know about Forex charts online, from reading the most basic line chart to leveraging advanced technical indicators on sophisticated platforms.
The Three Pillars: Core Types of Forex Charts
While modern charting software offers a variety of styles, virtually all technical analysis is built upon three primary types of charts. Understanding their construction and unique advantages is the first step toward market literacy.
The following table provides a clear comparison of these three essential chart types:
Beyond the Basics: Specialized Chart Types
As traders develop their skills, they often explore specialized charts designed to filter out noise or highlight specific market conditions.
- Heikin Ashi Charts: A variation of the candlestick chart that uses a modified formula to smooth out price data. This makes it significantly easier to identify and follow trends, as consecutive candles of the same color indicate a strong trend, while small candles with long wicks can signal a potential pause or reversal .
- Renko Charts: These charts focus purely on price movement, ignoring the passage of time. A new “brick” is only drawn when the price moves by a predetermined amount. Renko charts are excellent for identifying support and resistance levels with minimal noise .
- Point and Figure Charts: Another time-agnostic chart, Point and Figure uses columns of X’s and O’s to represent rising and falling prices. They are highly effective for filtering out minor fluctuations and focusing on significant price movements .
Choosing and Using Your Online Charting Platform
The platform hosting your charts is just as critical as your ability to read them. The right software can elevate your analysis, while the wrong one can hinder it.
Key Features to Look For in a Platform
When evaluating the best free Forex charting software in 2025, several key features stand out :
- Technical Indicators and Drawing Tools: A robust platform should offer a wide array of built-in indicators (like Moving Averages, RSI, MACD, and Bollinger Bands) and comprehensive drawing tools (like trendlines and Fibonacci retracements) for detailed analysis .
- Customization and Usability: The interface should be customizable to your trading style. Look for the ability to save chart templates, use multiple timeframes, and have an intuitive layout .
- Accessibility and Performance: In today’s mobile world, seamless synchronization between web, desktop, and mobile apps is crucial. The platform must also be reliable with fast, real-time data updates .
Matching a Platform to Your Trading Style
Your choice of platform should align with your approach to the markets:
- For Beginners: User-friendly platforms like TradingView or MetaTrader 4 (MT4) are ideal. They offer gentle learning curves, strong community features (TradingView), and widespread adoption with ample educational resources (MT4) .
- For Advanced and Algorithmic Traders: MetaTrader 5 (MT5) and cTrader are powerful successors. MT5 offers more timeframes and built-in indicators than MT4, while cTrader provides a modern interface, deep market depth, and advanced automated trading features .
- For Professional-Grade Analysis: Platforms like SaxoTraderPRO and ProRealTime cater to those needing high-level analysis, with extensive toolkits, advanced order management, and superior charting technologies .
From Viewing to Trading: A Step-by-Step Analysis Framework
Knowing the tools is one thing; using them effectively is another. Here is a practical framework for a beginner to conduct a structured analysis using online Forex charts.
- Determine the Macro Trend with a Higher Timeframe: Start your analysis on a daily (D1) or weekly (W1) chart. Apply a simple Moving Average (like the 50 or 200-period). Is the price above the MA? This indicates a potential uptrend. Is it below? This suggests a downtrend. This step defines the dominant market direction.
- Refine Your View with a Middle Timeframe: Zoom into the 4-hour (H4) or 1-hour (H1) chart. Here, look for key support and resistance levels—the price points where the market has historically reversed or paused. Also, identify the current chart pattern, such as a continuation pattern (like a triangle) or a reversal pattern (like a double top).
- Time Your Entry with a Lower Timeframe: Finally, switch to a lower timeframe like the 15-minute (M15) or 5-minute (M5) chart. Use this view to fine-tune your entry point. Look for candlestick patterns (like a Hammer at a support level) or momentum indicators (like the RSI moving out of oversold territory in an uptrend) to signal an opportune moment to enter a trade in the direction of the larger trend.
Conclusion
Online Forex charts are the universal language of the financial markets. Mastering their nuances—from the foundational candlestick to the complex indicator on a professional platform—is a journey that separates reactive gamblers from proactive traders. By understanding the different chart types, selecting a platform that fits your style, and applying a disciplined, multi-timeframe analysis framework, you equip yourself with the knowledge to navigate the volatile currency markets. Remember, the chart is a map of past and present price action; your skill in reading it will determine your success in forecasting its future direction.
Disclaimer
The information provided in this article is for educational and informational purposes only and should not be construed as financial, investment, or trading advice. Trading foreign exchange (Forex) on margin carries a high level of risk and may not be suitable for all investors. There is a possibility that you may sustain a loss equal to or greater than your entire investment; therefore, you should not invest or risk money that you are not prepared to lose. Past performance of any trading system or methodology is not necessarily indicative of future results. You should be aware of all the risks associated with Forex trading and seek advice from an independent financial advisor if you have any doubts.
FAQs
1. What is the best free online Forex charting platform for beginners?
For beginners, TradingView is often considered the best free platform. It features an intuitive, user-friendly interface that is easy to navigate without being overwhelming. Its powerful social component allows you to see the analyses and ideas of other traders, which is a fantastic learning tool. The free version offers a wide range of indicators and drawing tools, making it an excellent starting point for those new to technical analysis.
2. What is the main difference between a candlestick chart and a Heikin Ashi chart?
While both use a similar “candlestick” visual, the key difference is in the calculation. A standard candlestick chart shows the actual Open, High, Low, and Close (OHLC) for each period. Heikin Ashi charts use a modified formula that averages price data, creating a smoother look. This makes trends much easier to identify visually, but it also means the prices on the chart are not the exact market prices, which can be a drawback for precise entry and exit planning.
3. How many indicators should I use on my chart at one time?
A common beginner mistake is “indicator overload,” which leads to confusion from conflicting signals. It is far more effective to use a small selection of 2-4 indicators from different categories. For example, you might combine one trend-following indicator (like a Moving Average), one momentum oscillator (like the RSI), and one volatility tool (like Bollinger Bands). This provides a more balanced and confirming view of the market than using three different momentum indicators.
4. Can I rely solely on charts for Forex trading, or do I need other analysis?
This strategy is known as technical analysis, and many traders use it as their primary method. It operates on the premise that all known market information is already reflected in the price. However, a comprehensive approach often combines chart analysis with fundamental analysis (which focuses on economic news and events) and sentiment analysis. Furthermore, no analysis replaces the critical need for strict risk management, including the use of stop-loss orders.
5. Why is multi-timeframe analysis so important?
Analyzing multiple timeframes helps you avoid the trap of a narrow perspective. A “buy” signal on a 5-minute chart is far less meaningful if the overall daily chart is in a strong downtrend. A standard approach is to:
- Use a high timeframe (like Daily or H4) to identify the long-term trend.
- Use a middle timeframe (like H1) to find key support/resistance levels and trade setups.
- Use a low timeframe (like M15) to fine-tune your entry and exit points.
This ensures your trades are aligned with the market’s dominant momentum.