
September 2025 will be remembered as a watershed moment for financial markets, particularly for gold traders and forex investors. The month witnessed gold prices achieving an unprecedented rally, breaking through previous psychological barriers to establish new historic highs. Simultaneously, forex markets experienced significant volatility as traders grappled with evolving Federal Reserve policy, geopolitical tensions, and surprising economic data. This comprehensive analysis examines the key drivers behind these dramatic movements and provides actionable insights for traders navigating these dynamic market conditions. Understanding these interconnected trends is crucial for developing effective trading strategies as we approach the final quarter of 2025 .
Market Performance Overview: Gold’s Spectacular Surge
Record-Breaking Rally
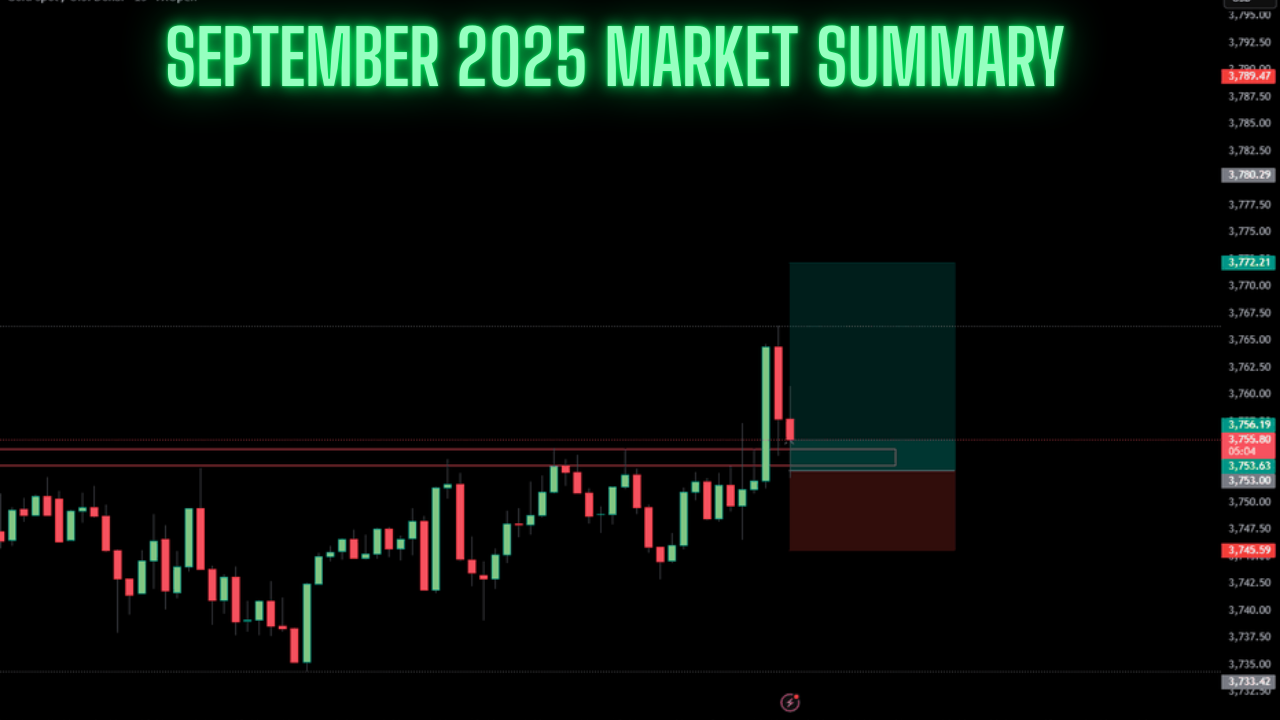
Gold prices delivered an extraordinary performance throughout September 2025, with the precious metal gaining approximately 10.91% over the month and an impressive 41.76% compared to the same period last year . The month was highlighted by gold reaching an all-time high of $3,791 per ounce on September 23, 2025, establishing a new benchmark for the commodity . Despite a modest pullback following this peak, gold demonstrated remarkable resilience by maintaining levels above $3,750, signaling underlying strength in the bullish trend .
Forex Market Reactions
The U.S. dollar exhibited mixed performance throughout September. The US Dollar Index (DXY) staged a recovery following cautious statements from Federal Reserve Chair Jerome Powell about the pace of future rate cuts, breaking through the 97.30 resistance level and ending a two-day decline earlier in the month . However, the dollar’s gains were tempered by ongoing concerns about U.S. trade policies and fiscal sustainability, which created a complex environment for currency traders .
Table: Key Market Performance Indicators for September 2025
Key Market Drivers: What Fueled Gold’s Rally?
Federal Reserve Policy Expectations
The primary catalyst for gold’s September surge stemmed from evolving expectations regarding U.S. monetary policy. The Federal Open Market Committee (FOMC) implemented a 25-basis point rate cut in September, bringing the benchmark interest rate to a range of 4.00%-4.25% . More significantly, the Fed’s projections indicated an additional 50-basis points of cuts by year-end, with further easing expected in 2026 . This dovish pivot reduces the opportunity cost of holding non-yielding assets like gold, making bullion more attractive to investors .
Fed Chair Jerome Powell emphasized that the central bank had shifted its risk assessment due to emerging labor market weaknesses, stating that the unemployment rate had risen (though remaining historically low) and job growth had slowed . This acknowledgment of balancing persistent inflation with labor market concerns created what Powell described as a “difficult situation,” increasing gold’s appeal as a safe-haven asset amid policy uncertainty .
Geopolitical Tensions and Safe-Haven Demand
September witnessed escalating geopolitical concerns that further boosted gold’s attractiveness. NATO’s declaration that it would take necessary action to defend itself after Russia’s violation of Estonian airspace renewed tensions between major powers . Additionally, the U.S. administration reignited trade policy concerns by planning aggressive tariffs on patented pharmaceutical goods and other medical equipment, while also taking a more hawkish stance against Russia by suggesting Ukraine could recover territory lost since the invasion .
These developments occurred alongside lingering concerns about U.S. fiscal sustainability, with markets worried that “a flurry of fresh debt by the U.S. Treasury and the jeopardy on the Fed’s autonomy could erode confidence in the dollar” . This combination of factors drove significant safe-haven flows into gold, particularly from international investors seeking alternatives to dollar-denominated assets.
Central Bank Accumulation and ETF inflows
Structural support for gold prices remained robust throughout September. Central banks continued their aggressive accumulation strategies, with reported purchases forecast to reach approximately 900 tonnes in 2025 as part of ongoing diversification away from U.S. dollar reserves . This trend has been particularly pronounced among emerging market central banks seeking to reduce their exposure to potential dollar volatility.
Concurrently, gold exchange-traded funds (ETFs) experienced substantial inflows, with year-to-date totals reaching 310 tonnes—representing approximately 10% growth in total global holdings . U.S. ETF holdings increased by 9.5%, while Chinese ETF holdings surged by an remarkable 70%, indicating strong retail and institutional participation in the gold rally .
Technical Analysis: Key Levels and Chart Patterns
Gold Price Structure and Critical Thresholds
From a technical perspective, gold’s September price action formed a bullish consolidation pattern following its parabolic advance. Analysts observed the development of an “Ascending Triangle” formation, signaling potential for continued upward movement if resistance around $3,785 is decisively broken . The key short-term support level to watch is $3,688, with a breach of this level potentially indicating a deeper correction toward $3,660 or $3,620 .
The 14-day Relative Strength Index (RSI) reached approximately 78, firmly in overbought territory, suggesting the potential for near-term consolidation . However, the fact that gold has maintained elevated levels despite technically overbought conditions underscores the strength of the underlying bullish momentum .
Forex Market Technical Positioning
In currency markets, the U.S. dollar’s recovery faced significant resistance around the 97.80 level on the DXY . The dollar’s trajectory remained heavily dependent on upcoming economic data, particularly inflation metrics and employment figures that would influence Fed policy expectations. Major currency pairs including EUR/USD, GBP/USD, and USD/JPY exhibited range-bound characteristics as traders awaited clearer directional catalysts.
Forex Market Impact: Currency Correlations and Opportunities
U.S. Dollar Dynamics
The U.S. dollar experienced conflicting pressures throughout September. On one hand, expectations of continued Fed rate cuts typically weigh on a currency, and the DXY indeed faced headwinds from the central bank’s dovish pivot . However, the dollar also benefited from its traditional safe-haven status during periods of geopolitical uncertainty, creating a complex trading environment .
The dollar’s performance was further complicated by strong economic data, including revised GDP growth of 3.8% in the second quarter and unexpected rises in durable goods orders, which tempered expectations for aggressive near-term rate cuts . This economic resilience provided underlying support for the currency even as the Fed signaled a easing bias.
Major Currency Pair Reactions
- EUR/USD: Traded with a slight bearish bias as European economic concerns offset dollar weakness
- GBP/USD: Showed resilience but remained sensitive to UK-specific economic developments
- USD/JPY: Exhibited volatility as traders balanced yield differentials with safe-haven flows
- Commodity Currencies: AUD, CAD, and NZD faced headwinds from gold’s rally but benefited from broader dollar uncertainty
Trading Strategies for Current Market Conditions
Gold Trading Approaches
For traders navigating these market conditions, several strategic approaches have proven effective:
- Breakout Strategy: Position for a decisive break above $3,785 resistance with targets at $3,820-$3,840 and potentially $3,865
- Pullback Approach: Wait for retracements toward support zones between $3,660-$3,690 for potential long entries with favorable risk-reward ratios
- Range Trading: Capitalize on volatility within the established $3,688-$3,785 trading range
Risk management remains paramount, with experts advising position sizing that accounts for elevated volatility and the use of stop-loss orders below key support levels .
Forex Trading Considerations
In forex markets, traders should:
- Monitor Economic Calendars: Key releases including PCE inflation data and employment reports will significantly impact currency valuations
- Track Yield Differentials: Changes in relative interest rate expectations between currencies create trading opportunities
- Assess Risk Sentiment: Geopolitical developments and their impact on overall market risk appetite will influence currency flows
Market Outlook: What to Watch in Q4 2025
Critical Factors and Event Risks
As we transition to the fourth quarter, several factors will determine the sustainability of gold’s rally and forex market directions:
- Federal Reserve Policy Implementation: Actual versus expected pace of rate cuts will be crucial
- Inflation Trajectory: PCE data and CPI readings will influence policy expectations
- Geopolitical Developments: Escalation or de-escalation of trade and military tensions
- U.S. Fiscal Policy: Market reactions to Treasury issuance and deficit concerns
- Central Bank Activity: Continuation or moderation of gold purchasing programs
Price Projections and Analyst Expectations
According to Trading Economics global macro models, gold is expected to trade around $3,822 per ounce by the end of the fourth quarter, with potential to reach $3,987 within twelve months . J.P. Morgan Research maintains even more bullish projections, forecasting prices to average $3,675 per ounce in Q4 2025 and rise toward $4,000 by mid-2026 . These projections suggest that despite September’s impressive gains, fundamental and technical factors continue to support gold’s upward trajectory.
Conclusion: Navigating Volatility with Strategic Discipline
September 2025 demonstrated the dynamic interplay between monetary policy, geopolitical risk, and market technicals in driving both gold and forex valuations. Gold’s record-breaking performance underscored its role as a premier safe-haven asset during periods of policy uncertainty and international tension. Meanwhile, forex markets exhibited nuanced reactions to the same fundamental drivers, creating opportunities for discerning traders.
As we move forward, maintaining strategic discipline and risk-aware positioning will be essential for capitalizing on continued volatility. Traders should focus on key technical levels in gold, monitor evolving Fed communication, and remain agile in responding to geopolitical developments. The trends established in September suggest that the final quarter of 2025 will offer significant opportunities for well-prepared traders across both gold and forex markets.
Disclaimer: This market analysis is for informational purposes only and does not constitute financial advice, investment recommendation, or an offer or solicitation to buy or sell any financial instruments. Trading gold, forex, and other financial instruments carries a high level of risk and may not be suitable for all investors. You should conduct your own research and consult with a qualified financial professional before making any investment decisions. Past performance is not indicative of future results.
FAQs
1. What was the main reason gold reached record highs in September 2025?
Answer: Gold’s record-breaking rally to $3,791 per ounce was primarily driven by three key factors:
- Federal Reserve Policy Shift: The Fed implemented a 25-basis point rate cut and signaled additional easing, reducing the opportunity cost of holding non-yielding gold
- Geopolitical Tensions: Escalating conflicts, including Russia’s violation of Estonian airspace and renewed trade tensions, boosted safe-haven demand
- Central Bank Accumulation: Reported central bank purchases reached approximately 900 tonnes in 2025 as part of diversification away from US dollar reserves
These factors combined to create perfect conditions for gold’s strongest monthly performance in recent years.
2. How did the US dollar perform despite the Fed’s dovish policy in September?
Answer: The US dollar exhibited surprising resilience with mixed performance:
Supporting Factors:
- Strong economic data (3.8% GDP growth, rising durable goods orders)
- Safe-haven demand during geopolitical uncertainty
- Fed Chair Powell’s cautious tone about future rate cuts
Pressuring Factors:
- Expectations of continued monetary easing
- Concerns about US fiscal sustainability and debt levels
The US Dollar Index (DXY) recovered above 97.30 but faced resistance near 97.80, reflecting the market’s balancing of these conflicting forces.
3. What are the key technical levels to watch for gold after September’s rally?
Answer: Technical analysts are watching these critical levels:
Resistance Levels:
- Immediate: $3,785-$3,800 (September high)
- Secondary: $3,820-$3,840 (projected breakout target)
- Major: $3,865 (extended bullish target)
Support Levels:
- Primary: $3,688-$3,710 (recent consolidation zone)
- Secondary: $3,660-$3,680 (key Fibonacci retracement)
- Major: $3,620 (38.2% retracement of recent rally)
The 14-day RSI near 78 suggests gold is overbought, indicating potential for near-term consolidation.
4. How are central banks influencing gold prices in the current market?
Answer: Central bank activity remains a major structural support for gold:
Current Trends:
- Aggressive Purchasing: Forecasted to reach 900 tonnes in 2025
- Diversification Motive: Reducing exposure to US dollar assets
- Geopolitical Strategy: Particularly strong among emerging market central banks
- ETF Inflows: Global gold ETF holdings grew by 10% year-to-date
This institutional demand provides a solid foundation for gold prices, making sharp declines less likely even during technical corrections.
5. What should traders watch in Q4 2025 for gold and forex markets?
Answer: Key factors to monitor in the coming quarter include:
Economic Data:
- PCE inflation readings (Fed’s preferred gauge)
- Employment reports and wage growth data
- GDP revisions and manufacturing indicators
Policy Developments:
- Fed meeting outcomes and dot plot projections
- Actual versus expected pace of rate cuts
- Central bank communications from ECB, BOJ, and others
Geopolitical Risks:
- Escalation or de-escalation of current conflicts
- US trade policy developments
- US fiscal policy and debt concerns


One Comment
Utterly indited subject material, Really enjoyed looking through.